A directory without analytics is a black box. You don’t know if clients are searching, what they’re searching for, or whether they’re finding what they need. Hunhu’s analytics dashboard gives agencies and providers the visibility they need to make their network work harder.
What you can track
- Directory page views and unique visitors
- Most-searched specialties and locations
- Provider profile click-throughs
- Booking link clicks and conversion rates
- Commission revenue earned and pending
- Search-to-booking funnel analysis
Use search pattern data to identify gaps in your network. If clients are searching for a specialty you don’t cover, that’s your signal to recruit.
See What's Working. Act on What's Not.
Real-time analytics for agencies and providers. Track directory traffic, search patterns, click-throughs, booking conversions, and revenue. Know exactly where to focus to grow your network.
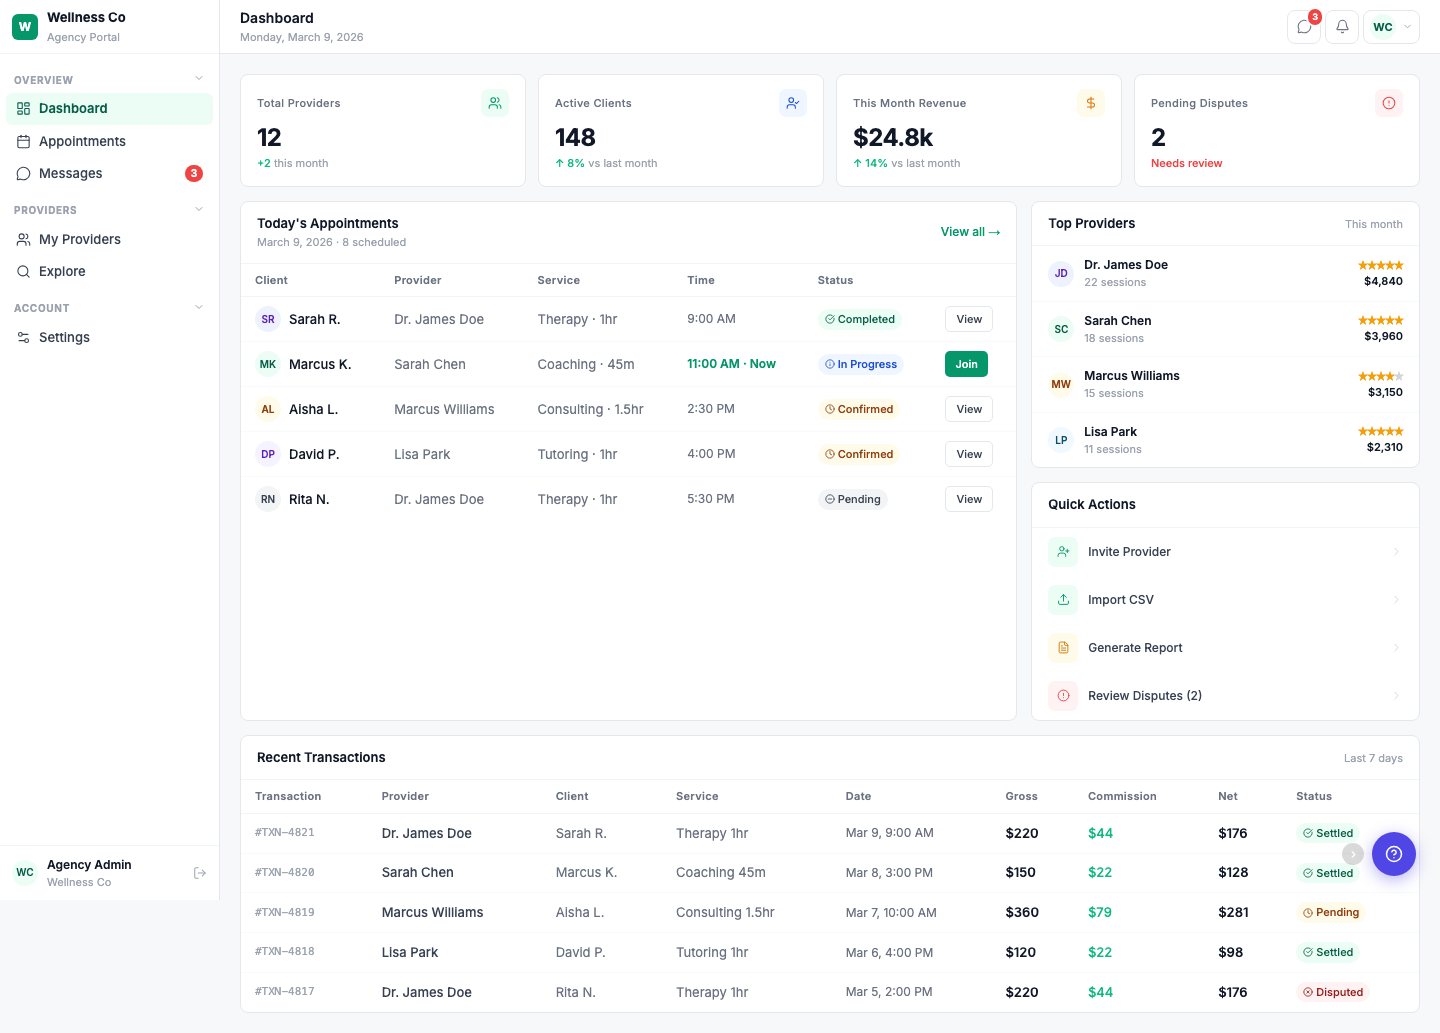
Agency Dashboard Metrics
- Total Providers — How many providers are in your network, with month-over-month growth.
- Active Clients — Unique clients who have booked through your directory this month.
- Monthly Revenue — Total commissions earned, with percentage change vs. last month.
- Pending Disputes — Open disputes that need review, flagged for quick resolution.
Today's Appointments View
See every appointment scheduled for today in one table — client name, provider, service, time, and live status (Completed, In Progress, Confirmed, Pending). Jump into any appointment with one click.
Top Providers Leaderboard
Your highest-performing providers ranked by session count and earnings. Identify who's driving the most value in your network and which providers might need support.
Quick Actions
From the dashboard, you can:
- Invite a new provider to your network
- Import providers via CSV
- Generate reports for any date range
- Review open disputes
Revenue Tracking
The Recent Transactions table shows every booking with full financial detail — gross amount, commission, net to provider, and settlement status (Settled, Pending, Disputed). Filter by date range to see last 7 days, 30 days, or custom periods.
Agencies that review their dashboard weekly and act on the data grow their provider networks 2x faster than those that check in monthly.
Review your dashboard at least once a week to spot trends early, resolve disputes quickly, and double the growth rate of your provider network.
- Scan your key metrics
Start with Total Providers, Active Clients, Monthly Revenue, and Pending Disputes to understand overall performance and where attention is needed. - Review today’s appointments
Open the Today’s Appointments view to monitor live statuses, ensure coverage, and quickly jump into any appointment that needs attention. - Identify top and at-risk providers
Use the Top Providers Leaderboard to see who’s driving the most value and which providers may need outreach, training, or promotion. - Act with quick actions
Invite or import new providers, generate performance reports for stakeholders, and review open disputes directly from the dashboard. - Audit recent revenue
Check the Recent Transactions table to verify gross amounts, commissions, provider payouts, and settlement statuses across your chosen date range.
Weekly Dashboard Ritual
- Monday: Check Total Providers and Active Clients to confirm growth direction.
- Midweek: Review Today’s Appointments and Pending Disputes to keep operations smooth.
- Friday: Export or generate revenue and performance reports for stakeholders.
- Monthly: Compare month-over-month revenue and provider performance to refine your growth strategy.